Google Cloud Operations - Debugger, Profiler & Trace
Debugger
At the heart of measuring application performance in Google Cloud lies Cloud Debugger. It lets you inspect the state of a running application in real time without stopping your application or slowing it down, all at no cost. With Cloud Debugger, you can examine your code's function and performance under actual production conditions.
How convenient is that?
In addition to real-time app debugging, Cloud Debugger allows you to capture the state of your application in production at a specific line location with snapshots.
Moving on from snapshots, you can also use log points to inject a new logging statement on demand at a specific line location, as well as capture a snapshot or write a log point message only when you need it using a simple conditional expression written in your application's language.
The ease of use of Cloud Debugger is further extended by its integration with existing developer workflows and popular IDEs. You can easily collaborate with other teams by sharing your debug session.
Debugger also knows how to display the correct version of your source code because it easily integrates with the version control systems such as cloud source repositories, GitHub, Bitbucket, or GitLab.
Profiler
The major component of measuring your application's performance is Cloud Profiler. Poorly performing code increases the latency and cost of applications in web services every day without anyone knowing or doing anything about it.
To solve it, Cloud Profiler continuously analyzes the performance of CPU-intensive and memory-intensive functions across an application Cloud Profiler does this by using statistical techniques and extremely low-impact instrumentation that runs across all production application instances to provide a complete CPU and heat picture of an application without slowing it down.
Trace
Cloud Trace can capture traces from applications deployed on App Engine, Compute Engine VMs, and Kubernetes Engine containers. It generates performance insights near real time and automatically generates in-depth latency reports.
Finally, Cloud Trace also continuously gathers and analyzes trace data to automatically identify recent changes to your application's performance. It also provides visualization and analysis to understand request flow, service topology, and latency issues in your app.
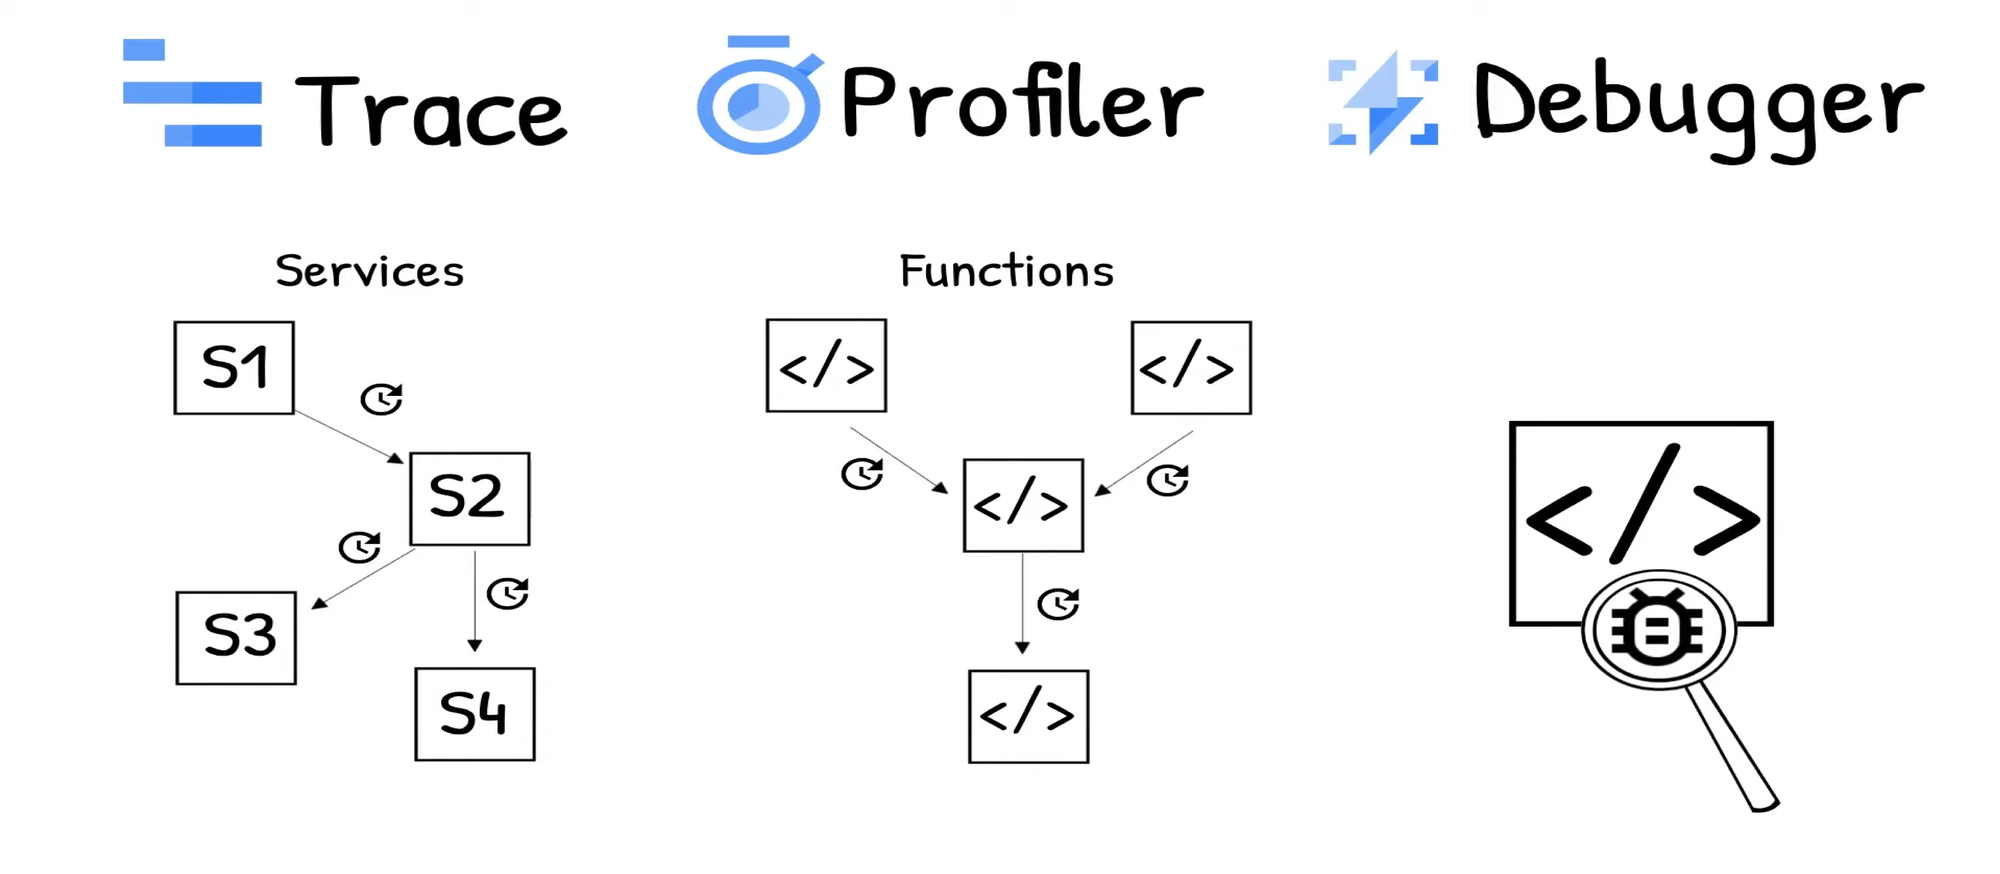
Altogether, while Trace is used to track relationships and latency between services, Profiler tracks this across the individual functions in your code base. And Debugger helps find the root cause from method to the specific problematic piece of code.