Google Cloud Operations - Monitoring, Logging & Error Reporting
Google Cloud Operations is a suite of products to monitor, troubleshoot, and operate your services at scale, enabling your DevOps, SRE, or IT operations teams to utilize the Google's SRE best practices. It also adds advanced observability features, including a debugger and a profiler.
Now let's look at the services individually,
Cloud Monitoring
Cloud Monitoring checks the viability of cloud resources and applications. It provides visibility into metrics such as CPU use, disk I/O, memory, network traffic, uptime and other custom metrics. Cloud Monitoring allows you to collect metrics from multi cloud and hybrid infrastructure in real time.
It supports a variety of metrics integrations and allows you to define custom metrics unique to your use case and even send those metrics to external systems.
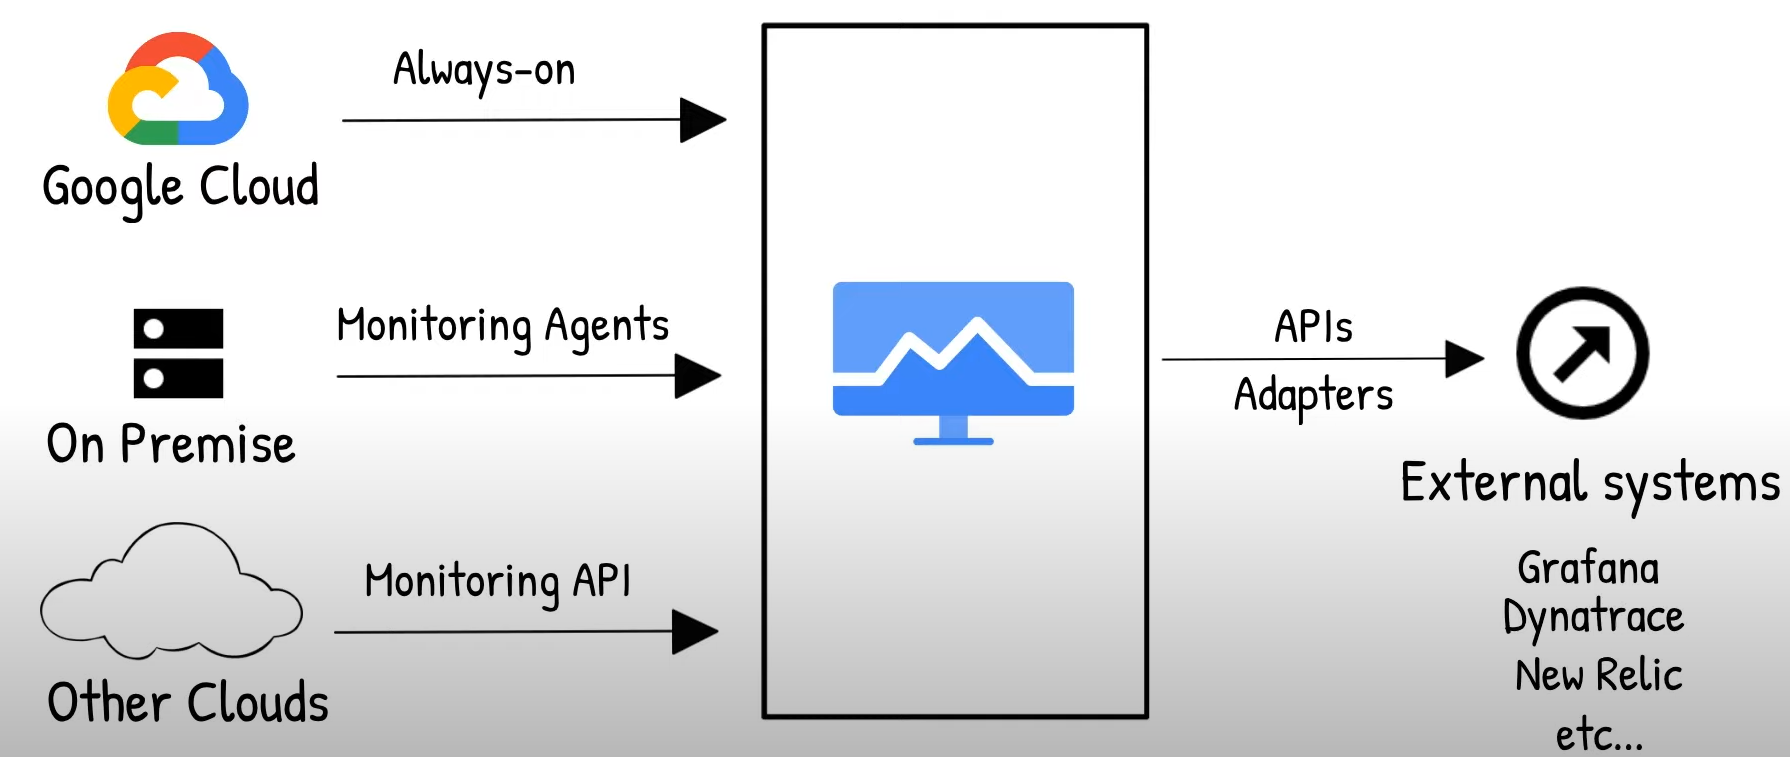
It is based on collectd, an open source daemon that gathers system and application performance data. It can also monitor Google Compute Engine (GCE) and EC2 VMs.
By using cloud monitoring, you can answer important questions like,
* what is the load on my service?
* Is my website responding correctly?
* Is my service performing well?
To understand the current load on a service or to view performance data of your service for the past month, use the charts and dashboard tools.
If you don't want to save the chart to a custom dashboard but you want to keep a reference to the chart, then save the chart URL. Dashboards are one way for you to view and analyze metric data.
But we know that you cannot sit around all day looking at dashboards, so If you're interested in being notified if your deployed service isn't accessible or responding correctly, then configure an uptime check and attach an alerting policy on performance metrics and service-level indicators.
In Metrics Explorer, you can also explore metric lists for all GCP services and add them to different chart types. Monitoring has many predefined metric types and monitored resources available. But you can also create custom metrics.
The Cloud Console provides 15 predefined dashboards that require no setup or configuration. Your Google Cloud project resources determine the dashboards available for you. For example, if your project contains Compute Engine instances, then your project includes dashboards for VM instances and for disks.
Cloud Logging
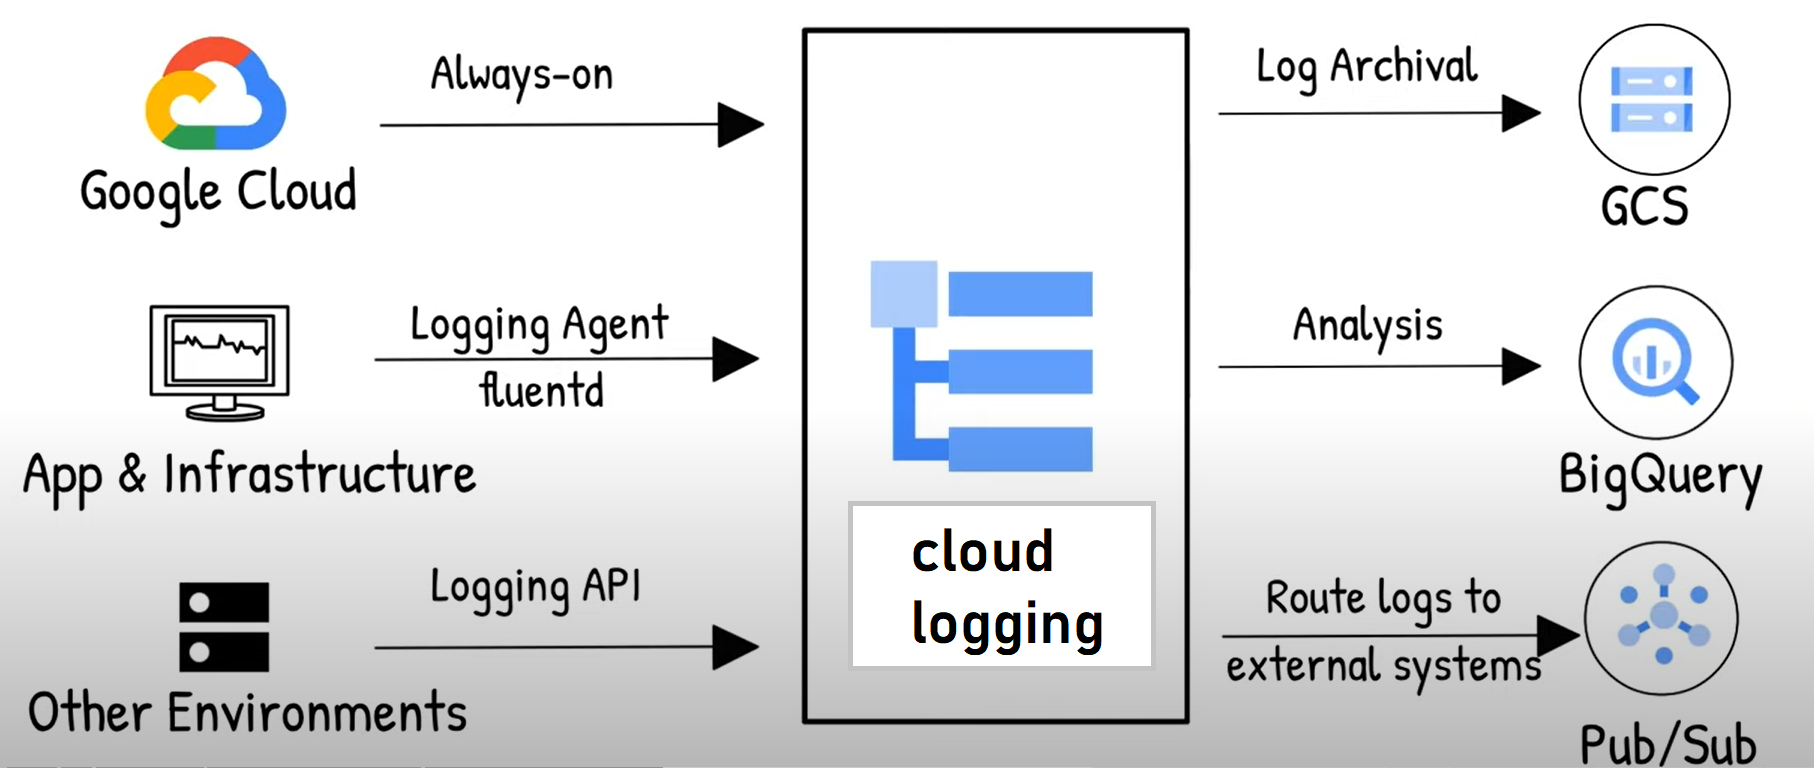
Cloud Logging provides a centralized Cloud Logging system that you can use to store, search, analyze, monitor, and alerts log data and events from all Google Cloud resources but also to collect data from multi cloud environments with Anthos integration.
Cloud Logging also provides integration into third-party systems through the API and Cloud Pub/Sub. The export functionality allows you to perform aggregated analytics in BigQuery and store your logs in Google Cloud Storage.
There are three key log categories, audit logs, agent logs, and network logs.
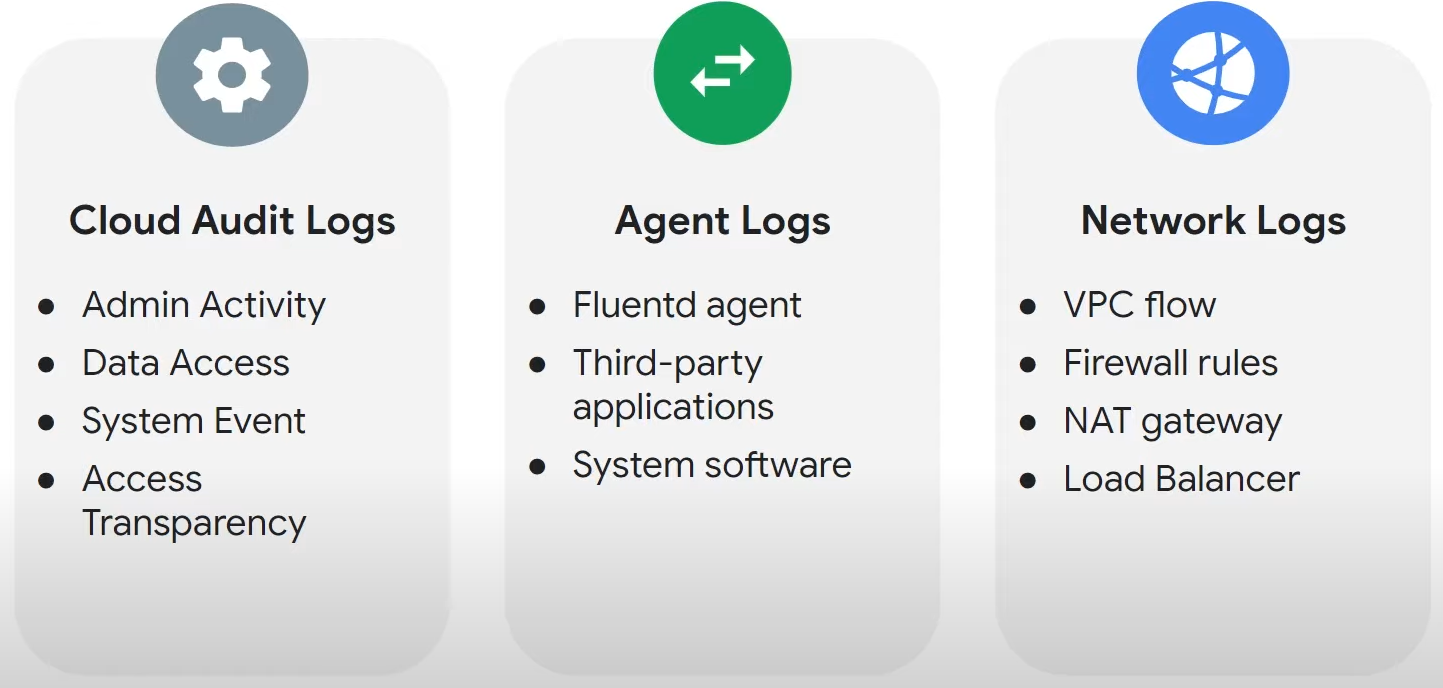
Audit logs help answer the question, who did what, where, and when? and those are admin activity logs, data access logs, system event, and data transparency logs.
Agent logs use a Google customized and packaged Fluentd agent that can be installed on any Google Cloud or AWS VM instance and ingest logs from Google Cloud or AWS EC2 instance.
Network logs provide in-depth network telemetry with PPC flow logs, firewall rules, NAT gateway, and load balancer types.
Error Reporting
Error reporting counts, analyzes, and aggregates the crashes in your running cloud services. A dedicated view shows the error details, time chart, occurrences, affected user count, first and last seen dates, and a cleaned exception stack trace. You can opt in to receive email and mobile alerts on new errors.